The California License Geography project at the Cannabis Studies Lab analyzes publicly available data from the Department of Cannabis Control (DCC) Unified License Search webpage to visualize and analyze the uneven implementation of legal cannabis within California. This post reflects data pulled from the database on January 29, 2024.
Purpose
This information will be very useful for our students as they begin to learn about landscapes of cannabis legalization, but it also will be helpful to a wide range of stakeholders in the public and private sector.
We will focus on creating geographies of license locations across the California landscape, for all license types involved in the supply chain. Since we are based out of Humboldt County, the historical epicenter of California cultivation, we start this project with a series of posts focusing on cultivation.
What Counties in California Permit Cultivation?
Our first post introduces readers to the many interesting ways we can think about where, in California, licensed cannabis cultivation happens, and what are some of the ways we can think geographically about it. Not all counties permit cultivation, and the ones that do vary widely in more ways than just where they are found in the state.
Some counties permit very large operations, some permit only smaller operations. Some counties’ cultivations are predominantly outdoor, some are predominantly indoor. Some have many unique owners, and some have very few unique owners. Some counties have equity programs and other forms of assistance that help qualified equity stakeholders, and some do not.
What kind of information we process from the DCC database helps us tell different parts of a story that is far more complex than it seems. Once we draw up profiles for each county, and do a little comparison, we can and will begin to supplement county profiles with additional demographic, economic, and cultural information.
Before we begin, however, it is important to note the limitations of the data itself as well as be clear about how, as the data changes over time, the geographies we construct will need updating.
Limitations of the Data
DCC data is drawn from information that the state has collected, which may or may not correlate with information that local jurisdictions collect. The accuracy of the state data cannot be guaranteed without doing the sort of checking that is beyond the scope of our activities. So let’s be clear: we cannot guarantee the accuracy of the data. Usually, local jurisdictions have more up-to-date information about active licensees, but even then, that information usually lags between the moment a firm goes out of business and when it is entered into the system.
Firms are constantly going in and out of business, and when it comes to cultivation some of them may even go fallow in any given season. These last few years, more cultivation firms have gone out of business than have gone in.
In this post, we will start with the basic question – what counties in California have permitted cultivation licenses? basic question – what counties in California have permitted cultivation licenses?
What are “Cultivation Counties” for Our Purposes?
There are a lot of nuances to the uneven distribution of cultivation licenses across the state. “Local control” means that cities and counties can opt out of implementing any form of legal cannabis, and to date, most of them have.
There are 468 Cities and 58 Counties in California – and more than half of them ban licenses of any type.
Even more complicated is the fact that cities within “ban” counties can permit cultivation (or other) license types; and vice versa – counties can permit cultivation license types while cities within counties ban them. Even Humboldt County has four cities that ban all license types!
The data in the DCC database provides county information for cultivation licenses, but not city information. So, our “cultivation county” geographic information actually includes counties that ban cultivation that have cities that do not!
So – let’s be clear that when we talk about “cultivation counties” in this and other posts, we actually aren’t talking about “counties that permit cultivation. We are referring to counties within whose borders cultivation licenses are permitted, either by the counties themselves or by cities within county borders.
Let’s take a look at what counties in the state host licensed cannabis cultivation, ordered by the total number of active licenses indicated by the DCC database as of 1/29/2024.
Where are “Cultivation Counties” in California?
Cultivation Counties that Permit Cultivation (40)
| Humboldt | Calaveras | Sonoma | Alameda | San Francisco |
| Santa Barbara | San Bernardino | Yolo | Shasta | Colusa |
| Mendocino | Riverside | Inyo | Tulare | Merced |
| Los Angeles | Fresno | Contra Costa | Santa Clara | Imperial |
| Trinity | Sacramento | San Luis Obispo | San Mateo | El Dorado |
| Lake | Nevada | Kern | San Diego | Mono |
| Monterey | Santa Cruz | Stanislaus | San Benito | Solano |
| Kings | Ventura | Orange | San Joaquin | Del Norte |
Cultivation Counties that Ban Cultivation but have Cities that Permit Cultivation (6)
| Madera | Marin | Napa | Siskiyou | Yuba | Tehama |
Counties that Ban Cultivation (12)
| Alpine | Amador | Butte | Lassen | Mariposa | Glenn |
| Modoc | Placer | Plumas | Sierra | Sutter | Tuolumne |
Visualizing California Licensed Cannabis Cultivation Geography
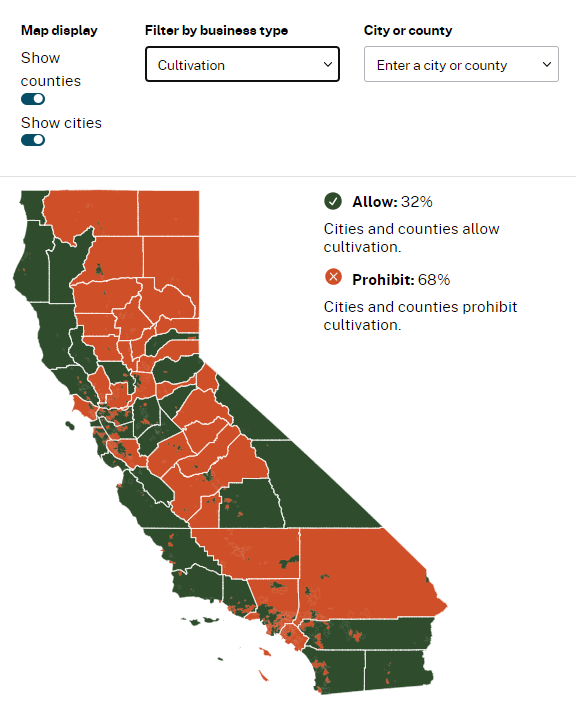
The Department of Cannabis Control has a neat data tool allowing curious readers to map local control across the state.
We took a snapshot of the “Where Cannabis Licenses are Allowed” data tool on March 1, 2024 to illustrate the lists above:

0 Comments